|
Архитектура Аудит Военная наука Иностранные языки Медицина Металлургия Метрология Образование Политология Производство Психология Стандартизация Технологии |
|
|
Архитектура Аудит Военная наука Иностранные языки Медицина Металлургия Метрология Образование Политология Производство Психология Стандартизация Технологии |
THE MECHANISM OF THE FUNCTIONING OF THE MARKET SYSTEMСтр 1 из 6Следующая ⇒
Topic 6 THE MECHANISM OF THE FUNCTIONING OF THE MARKET SYSTEM Demand of the individual consumer. Law of demand. Offer of an individual enterprise. Law of supply. Equilibrium of supply and demand. The equilibrium price. Elasticity of supply and demand. Price: concept and essence. Classification of price.
Behavior of the main subjects of the market economy (buyers and sellers) reflect the main elements of the market mechanism: demand and supply. The process of interaction between buyers and sellers is carried out in the market. ► The market is a mechanism that reveals the interaction of buyers (demand bearers) and sellers (suppliers) of individual goods and services. Through the system of interaction between supply and demand, the mechanism for the formation and functioning of a market economy is realized.
1. Demand of the individual consumer.Law of demand The concept of demand Demand as an economic category reflects the needs of people. It is needs people, their desire to create more comfortable living conditions and find its reflection in this category. And it should be noted that the needs of individuals are very diverse. This is due to personal personal preferences, tastes and, finally, traditions. ► Payable demand is the desire and the corresponding opportunity of consumer to purchase a particular product at a certain point in time. • The amount of demand is the amount of goods (products) that consumers are willing to purchase at an appropriate price in a certain period of time.
Law of demand - decreasing in the prices of the corresponding goods increases the demand for them, and an increasing in prices reduces demand for these goods. • Law of demand expresses an inverse relationship between the price of the commodity and the amount demand for it. The objective prerequisites for the emergence of the law of demand should be attributed the following provisions: 1. Consumers are willing to buy more of the product, but at a lower price. 2. Consumers purchase additional quantities of the product only on condition that its price is reduced. 3. The law of demand can be explained by the effects of income and substitution. The effect of income is that if the price of the goods is done, then at the same income the consumer can buy more goods, that is, the consumer's demand is growing. Higher price leads to the opposite result. The effect of substitution is expressed by the fact that, given its low price, the consumer has an incentive to buy cheap goods instead of similar goods, which now relatively more expensive. Consumers tend to replace expensive products cheaper.
Demand curve The inverse relationship between the price of a product and the amount of demand can be represented in the form of graph that showing the demand value on the horizontal axis, and the price on the vertical axis.
 Law of demand says that the consumer is willing to buy more products at a lower price than at a higher price. This is reflected in the demand curve (Graph 6.1). Law of demand says that the consumer is willing to buy more products at a lower price than at a higher price. This is reflected in the demand curve (Graph 6.1).
Law of demand does not apply in the following cases: a) in case of shortage of goods; b) in respect of expensive goods, the purchase of which is a means of saving; c) in respect of goods of prestigious demand non-price factors of demand. There are many other factors affecting the amount of demand. These include non-price demand factors (Table 6.1).
Table 6.1 - Non-price factors of demand
Thus, non-price factors cause changes in demand, which graphically reflects the demand curve (Figure 2).
Concept of the supply If the demand for the goods arises from the consumers, then the offer comes from the producer of the products. Supply can be defined as the ability of enterprises (organizations) to sell products on the market for certain prices. • Value of the supply - the volume of products that the domestic producers are ready to sell for a certain time on the market at an appropriate price.
The law of supply Supply of producers are related with many factors in the market, but the main one is the price. Therefore, the relationship between the volume of supply of products on the market and its price is directly dependent. This dependence has regularities. • Law of the supply says: with the increase in prices, the quantity of supply increases, and with the decrease in prices, the supply of goods is reduced. Supply law shows that producers are ready to manufacture and offer to the realization of a greater quantity of its product at a higher price than they would like this is done at a lower price. This is because the price of the product depends on the revenue of the manufacturer. In turn, revenue determines the profit margin /размер прибыли/ of the organization. High revenue corresponds - is usually greater profits. In addition, it is necessary to note that a low price may not cover the cost of production and sale of products. Therefore, it is the price of the goods that is the main material stimulus of the enterprise.
Supply curve A direct relationship between the amount of supply and the price of the product can be depicted graphically: this results in an upward direction of supply curve (Graph 6.3).
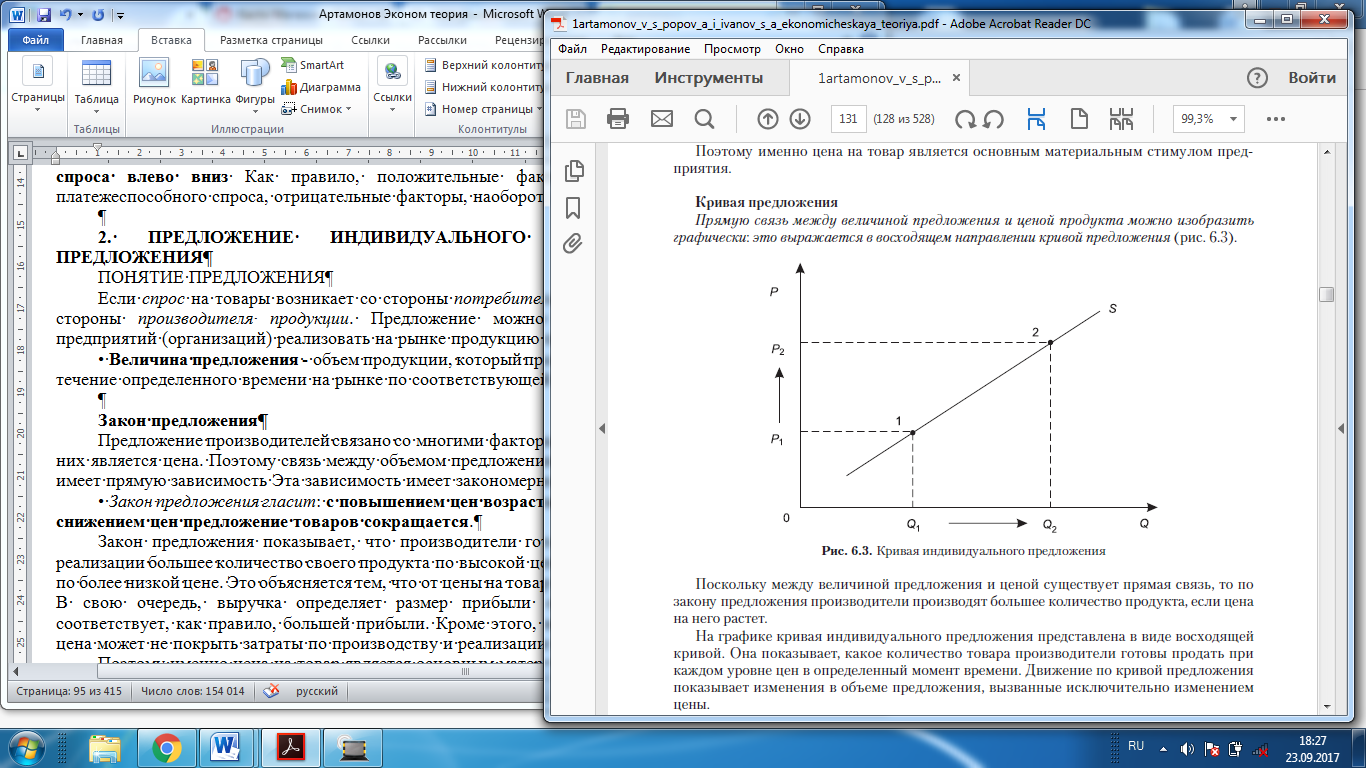 Since there is a direct relationship between the value of the supply and the price, to the law of supply, producers produce more product if the price it grows. Since there is a direct relationship between the value of the supply and the price, to the law of supply, producers produce more product if the price it grows.
On the graph, the curve of the individual supply is presented in the form of an ascending curve. It shows how many products producers are willing to sell at each level of prices at a certain point in time. Motion along the supply curve shows the changes in the volume of supply caused solely by the change prices. Non-price factors of supply The theory and practice show that to value of the producer's proposal, besides price factors, is influenced by non-price factors. This is due, above all, to those conditions that directly affect to the production scale (increase or decrease of volume of production of at preservation of prices). Non-price factors have an positive or negative impact on producer (Table 6.2).
Table 6.2 - Non-price factors of supply
Thus, non-price factors cause changes in supply, which is displayed by a corresponding shift in the supply curve (Figure 6.4).
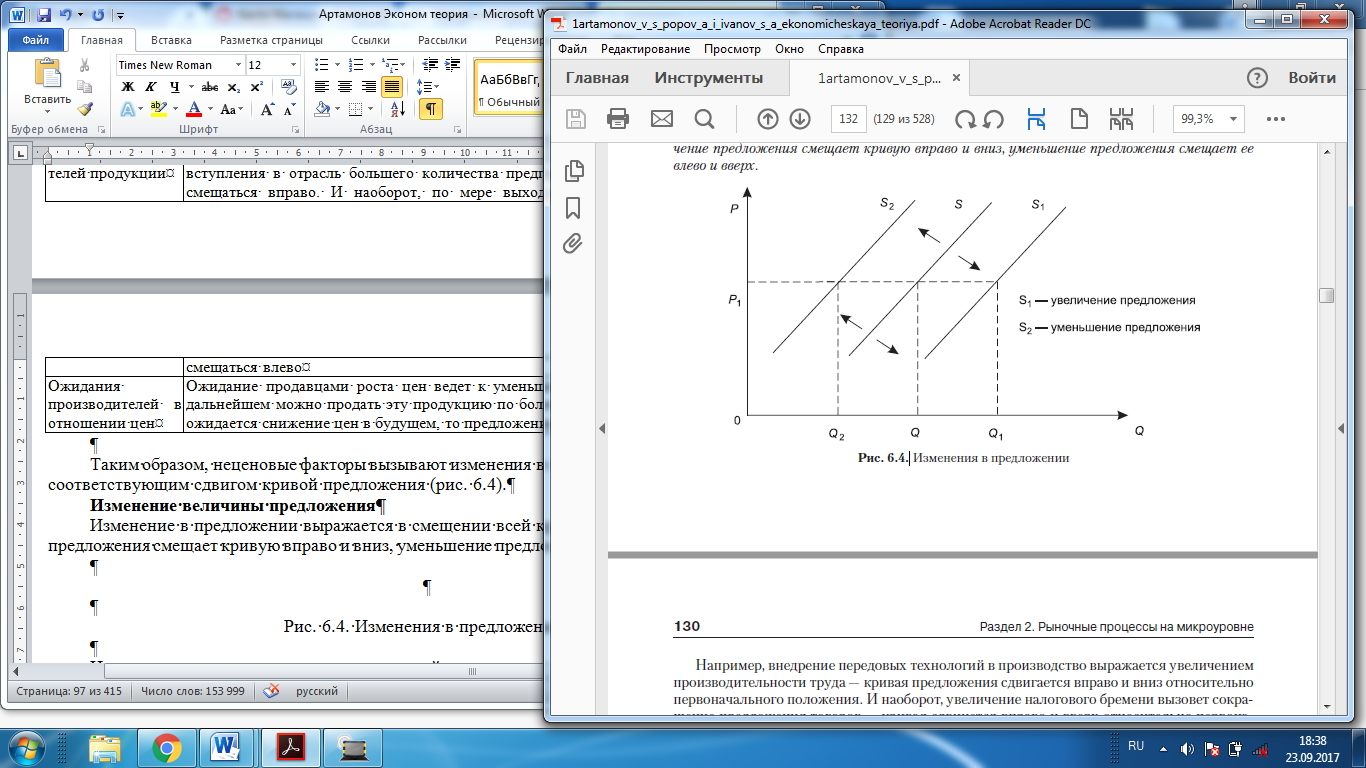
The change in supply is expressed in the displacement of the entire supply curve: increase of supply shifts the curve to the right and down, a decrease in the sentence shifts it left and up. For example, implemented of advanced technologies in production reflected the increase of labor productivity - supply curve shifts to the right and down relative initially position. Conversely, an increase in the tax burden will cause a reduction in the supply of goods - the curve will move to the right and upward relative to the initial position. At the same time, the price of the product will increase, and the supply volume will decrease.
3. Equilibrium of supply and demand.The equilibrium price Having ascertained the laws of supply and demand, it is necessary to consider the mechanism of market equilibrium. In order to understand how the market determines the price of a product and its quantity, which is actually sold and bought, it is necessary to analyze the mechanism of interaction between supply and demand.
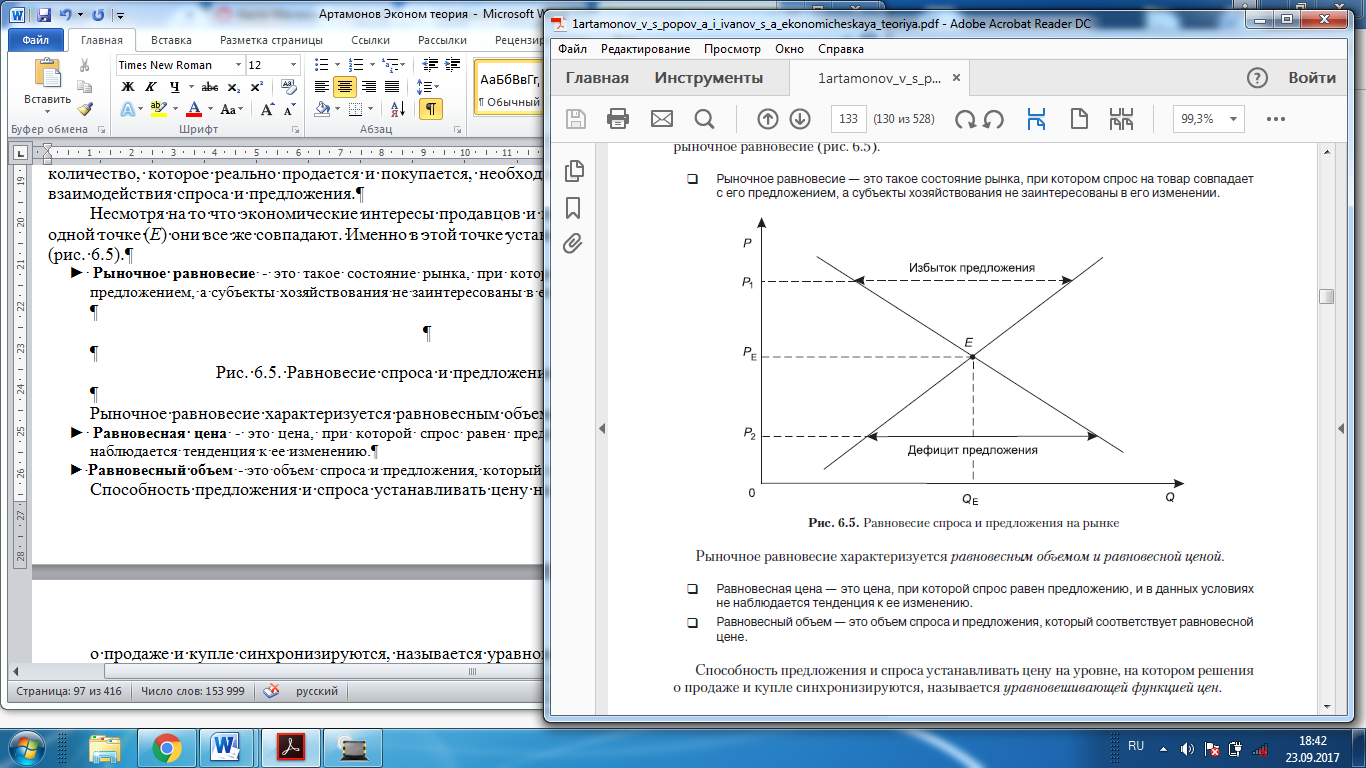
► Market equilibrium is a state of the market in which demand for goods coincides with its supply, and business entities are not interested in changing it. Market equilibrium is characterized by an equilibrium volume and an equilibrium price ► The equilibrium price is the price at which demand is equal to supply, and under these conditions there is no tendency to change it. ► The equilibrium volume is the volume of demand and supply, which corresponds to the equilibrium price. The ability of supply and demand to set a price at the level at which decisions about the sale and purchase are synchronized, is called the balancing price function. The equilibrium price unloads the market without leaving onerous surpluses for the sellers and without creating appreciable shortages for potential buyers. If these competitive prices did not automatically agree with each other on the supply and demand decisions, some kind of administrative control from outside governments to eliminate and manage shortages and excesses that otherwise case could arise. Market equilibrium exists as a result of a pervasive disruption and a restoration of the balance between supply and demand. In essence, this equilibrium is dynamic. ► Stability of equilibrium is the ability of a market system to restore market equilibrium in the face of internal forces or factors. At a price P1 above the equilibrium supply is more demand, and the market appears surplus. Surplus - this is a state of the market when the supply is more demand, and market the price is above the equilibrium price. In these circumstances, there is competition between producers, which stimulates price reductions. The supply of goods decreases, and demand, on the contrary, increases. The market is moving towards establishing equilibrium. At a price P2 below the equilibrium demand is more than supply, and there is a deficit in the market. Deficiency - this is a state of the market in which demand is greater than supply, and the market price is below the equilibrium price. In this case there is a competition of buyers who are already ready to pay a high price for this product. In these conditions, supply of producers is growing, and demand is gradually decreasing. Market system again moving in the direction of establishing equilibrium. It should be noted that in a competitive environment, the imbalance in market equilibrium and the deviation of the market price from equilibrium can’t be long, since equal weight, in principle, is established on the basis of the mechanism of self-regulation.
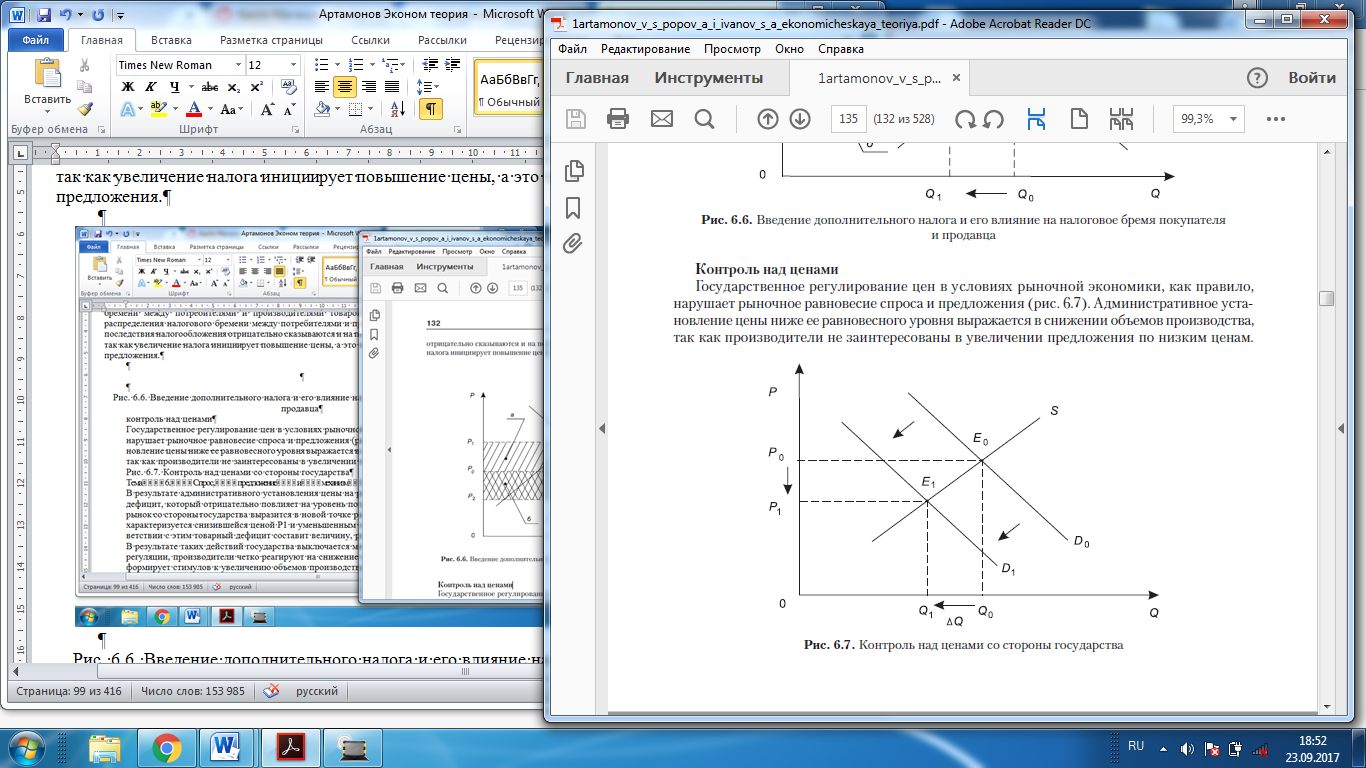
Control over prices State regulation of prices in a market economy, as a rule, breaks the market balance of supply and demand (Graph 6.7). The administrative pricing below its equilibrium level is expressed in a decrease in volumes of production, because producers are not interested in increasing the supply at low prices.
As a result of such actions of the state, the mechanism of market self-regulation is turned off, the producers are clearly reacting to the price reduction, which, in fact, does not create stimulus to increase production volumes (there is a violation of the law of supply). In this situation, the state should not restrict the price of the goods, but, conversely, create favorable conditions for the producer in order to increase the supply and, finally, to reduce prices in the market. All this, of course, is possible in conditions, if there is no artificial deterrence of the supply.
Method of point elasticity This method is used if there is functional relation consideration factors and should evaluate their mutual sensitivity in corresponding point. This relationship characterizes the relative change of one factor (for example, the volume of demand) with an infinitesimal change of another factor (for example, price): E = Q' (P) where: Е - coefficient of elasticity; Q'(P) is the derivative function of demand (or supply) at a price; P - market price; Q(P) - the amount of demand (or supply) at a given price. Let’s consider the following example: Estimation of point elasticity Let a function of demand for potato has the form Q d = 4.000 - 25P. Let’s estimate the elasticity of demand for the price of this product, if the market price was P = 10 monetary units per kg. To calculate the elasticity coefficient E, it is necessary to know the volume of demand at the existing price Q(P) and the derivative of the demand function at the price Q'(P). With a price of P = 10 monetary units per kg. Q d = 4000 - 25 P = 4000 - 25 × 10 = 3750 monetary units. Q'(P) = - 25. Substitute the obtained values in the formula: E = Q'(P) The economic sense of the received coefficient is the increase of potato prices by 1% relatively to the initial level will lead to a reduction in the demand value of 0,066%. The value of the received coefficient give evidence of a low elasticity of demand for the product in question. This method is characterized by high precision of results. At the same time, the need to make significant expenditures for preliminary market research and the derivation of the actual demand function for the factors of interest makes this method very expensive .
Method of arc elasticity This method is used in the case when practical observations do not allow us to determine the functional relation between the indicators interest to us. In such conditions, the market reaction is evaluated in the transition from one state (one point) to another state (another point), for example, a change in sales with an increase in price. Elasticity determination between two points on the demand or supply curve supposes knowledge of the initial and subsequent levels of the studied parameters, for example, prices and volumes. However, during calculations it is necessary to use the average values of the indicators: E = where: Р1 , Р2 - initial and subsequent prices; Q1, Q2 - initial and subsequent demand. Estimation of arc elasticity In purpose to stimulate sales, the company announced a decrease in prices for its products from 24 to 18 money units per unit. As a result, the enterprise increased sales volume from 10,000 to 18,000 units of product. Calculate the elasticity of consumer demand by the method of arc elasticity: E = Conclusion: the economic meaning of the coefficient lies in the fact that a decrease in the unit price by 1% leads to an increase in demand of 2%, which indicates a high elasticity of demand for the price of this product. Using this method gives an approximate value of the elasticity coefficient, the elasticity of demand. The degree of price elasticity or inelasticity of demand is measured using the coefficient of price elasticity, which is determined by the formula:
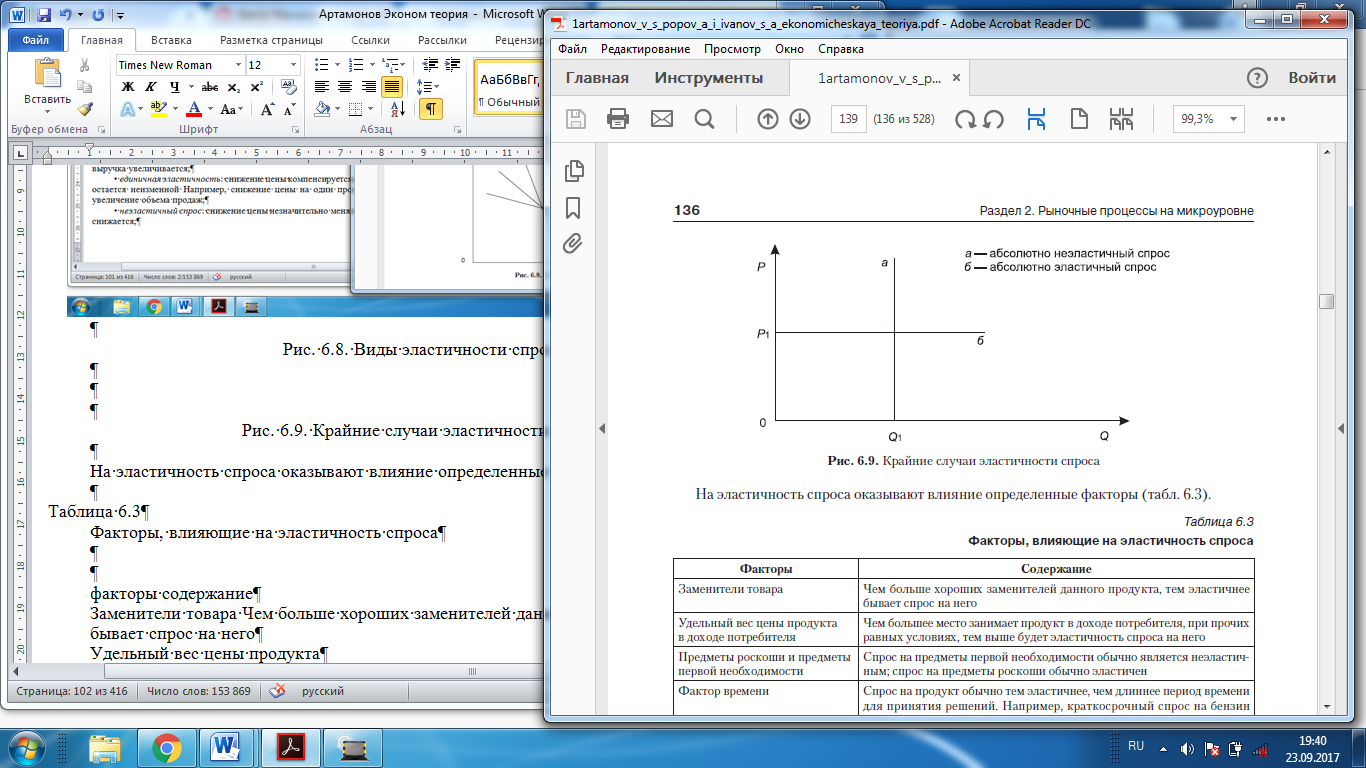
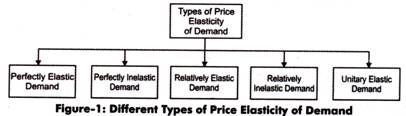
Elasticity of demand for income = In addition to the price factor, the consumer's income also affects the change in the market situation. Therefore, in addition to the elasticity of demand and price, it is possible to determine the elasticity of demand for income. The coefficient of elasticity of demand always has a negative value because demand and price change in opposite directions. However, for simplicity of analysis, it is considered as a positive quantity. In economic theory, the following types of price elasticity of demand are considered: • elastic demand: when the price decreases, the number of sales sharply increases and the total revenue increases; • unitary elasticity: the price reduction is compensated by the growth of sales, and the total revenue remains unchanged. For example, a one percent price reduction causes a one-percent increase in sales; • inelastic demand: the price decrease slightly changes the sales volume, the total you handle is reduced; • perfectly elastic demand: the price of the product does not change, despite the change in demand; • perfectly inelastic demand: a change in price does not have any effect on the volume of demand at all.
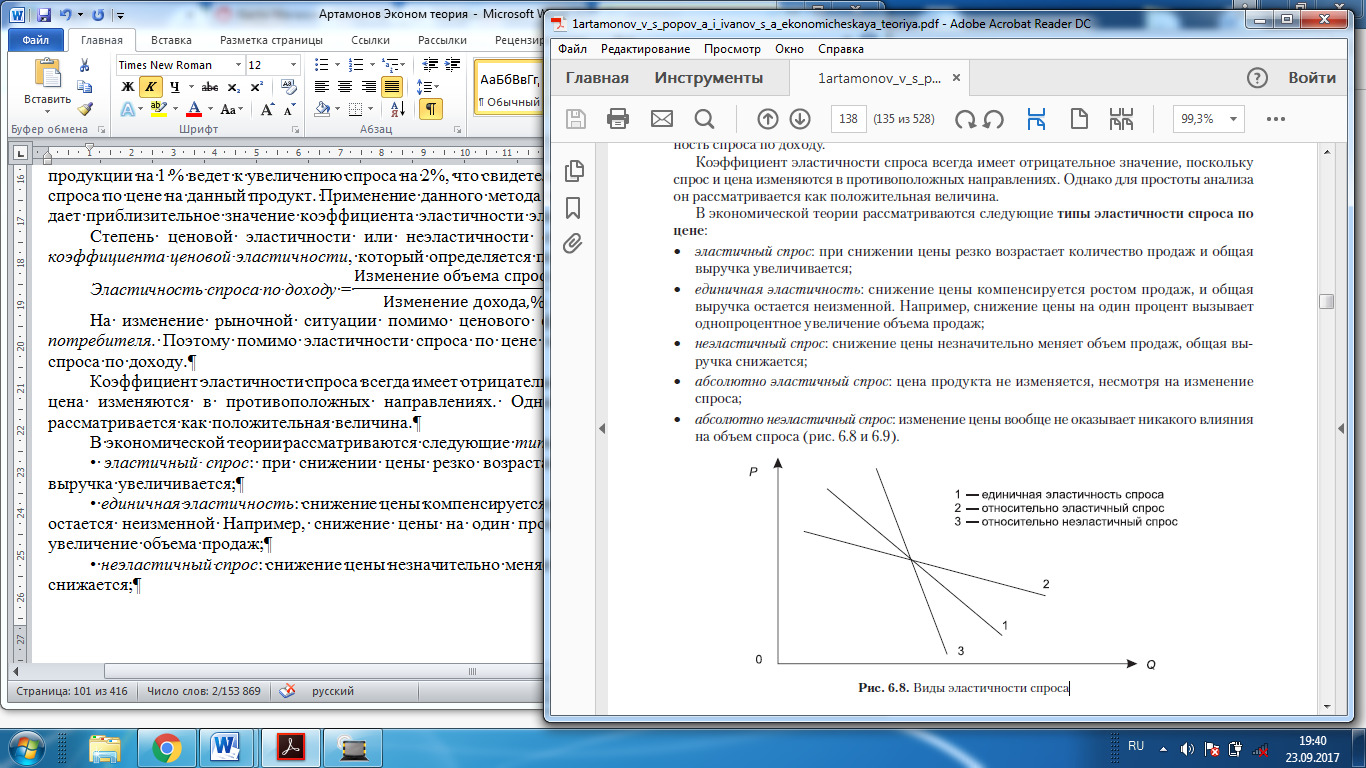
Graph 6.8 - Types of elasticity of demand Graph 6.9 - Extreme cases of elasticity of demand
The elasticity of demand is influenced by certain factors (Table 6.3).
Table 6.3 - Factors affecting the elasticity of demand
Elasticity of supply The degree of change in the volume of supply, depending on the increase in price, makes the supply elastic. It is measured by the elasticity of supply and is calculated by the same formula as the coefficient of price elasticity of demand. The only difference is that instead of the amount of demand, the value of the offer is taken. The offer is inelastic if the price change does not cause a change in the offer. The offer is considered absolutely elastic, when the slightest reduction in the price of the goods causes the supply to decrease to zero, and the slightest increase in the price causes an increase in supply In economic theory, consider the following guides types of elasticity of supply for the price: • elastic supply: means high sensitivity to the price at which the elasticity index is more than 1; • supply of unitary elasticity: means the same degree of change in price and volume of production; • inelastic supply: means a lower sensitivity to the price at which the elasticity index is less than 1; • perfectly elastic supply: any quantity of the goods will be offered at a fixed price; • perfectly inelastic proposal: a change in price does not have any effect on the supply volume at all. The proposal, since it is associated with a change in the production process, is slower to adapt to price changes than demand. Therefore, the time factor is the most important in determining the elasticity index. Usually, when assessing elasticity, three time periods are considered: short-term, medium-term and long-term (Table 6.4).
Table 6.4 - Time factor affecting to supply elasticity
5. Price: concept and essence. Classification of prices Classification of prices A. By regulated degree One of the important features of the classification of prices in a market is the degree of freedom of the regulatory impact of authorities of state control. Free prices. The overwhelming majority of prices emerging in the market are free, because they are established on the basis of a market equilibrium between supply and demand. Regulated prices. Along with free prices, there are regulated prices. In this case, at pricing, a significant role is played by the state, that, as a rule, limits the growth of prices for certain goods. The state as the body of power and management can set fixed prices on certain types of goods and products. Thus, in the market conditions there are two types of prices - free and regulated. B. By the nature of the serviced turnover In accordance with this classification, the following types of prices can be distinguished: • wholesale prices of the enterprise; • wholesale prices of industry; • prices for construction products; • procurement prices; • tariffs for freight and passenger transport; • retail prices; • tariffs for paid services rendered to the population; • prices serving the foreign trade turnover. Wholesale prices of the enterprise are the prices of producers, for which they sell their products to consumers, while compensating for the costs of production and sales and receiving a certain profit. Wholesale industry prices are the prices at which firms-consumers (organizations) pay for products to producer enterprises or to sale (wholesale) organizations. Prices for construction products are in the form of: a) the estimated cost for project construction; b) the list price; c) the contract price. Procurement prices are the prices at which agricultural products are sold. These prices, as a rule, are contractual in nature. Tariffs for freight and passenger transport reflect payment for freight and passenger transportation, which is charged by transport companies. Retail prices are the prices at which goods are sold in the retail trade network to the population by enterprises and organizations. B. Special types of prices In world practice, in addition to the listed types of prices, there are auction, exchange and contract prices. Auction price is the price of any product sold at auction. This given price can essentially differ from the market price, as reflects unique properties and attributes of the goods. Stock exchange price is the price at which the wholesale sale and purchase transaction is effected in the conditions of exchange trade; is a free price that fluctuates depending on the demand, the volume of the transaction, and so on. Contract price - the price at which the sale of goods depending on signed agreement.
Goal selection | ||||||||||||||||||||||||||||||||||||||||||||||||||||||||||
| Demand definition | Estimating costs | |||||||||||||||||||||||||||||||||||||||||||||||||||||||||
| Analysis of prices and products of competitors | ||||||||||||||||||||||||||||||||||||||||||||||||||||||||||
| Development of price strategy | ||||||||||||||||||||||||||||||||||||||||||||||||||||||||||
| Choice of pricing method | ||||||||||||||||||||||||||||||||||||||||||||||||||||||||||
| Setting the final price | ||||||||||||||||||||||||||||||||||||||||||||||||||||||||||
| Price behavior of the enterprise in the market | ||||||||||||||||||||||||||||||||||||||||||||||||||||||||||
The process of pricing in the enterprise is complex and includes several sections. And first of all, this is the choice of purpose. Any company must determine its purpose in the production and sale of goods. There are three main objectives of the price policy: sales support; profit maximization; market retention.
Questions for self-control
1. Define the term "market"
2. What is demand, what is the essence of the law of demand?
3. What are the non-price factors that determine the magnitude of demand?
4. What is the essence of the law of the offer?
5. What factors affect the proposal?
6. What is the equilibrium price and the equilibrium quantity of the product?
7. In which cases there is an excess, and in what cases - a shortage of products?
8. What is meant by the balancing price function?
9. What is the elasticity of supply and demand?
10. Give the main types of elasticity of supply and demand.
11. What is the price of products? Give the classification and the main types of prices.
12. What are the functions of the price? What is the essence of the pricing policy of the enterprise?
13. Formulate the main differences in price formation in a planned and market economy.
14. Is price regulation necessary in the market system of management? If so, why?
Topic 6
THE MECHANISM OF THE FUNCTIONING OF THE MARKET SYSTEM
Последнее изменение этой страницы: 2019-04-19; Просмотров: 387; Нарушение авторского права страницы

 ,
, = -0.66.
 :
:  ,
, :
:  = E =
= E =  :
:  = -2.
= -2. .
.