|
Архитектура Аудит Военная наука Иностранные языки Медицина Металлургия Метрология Образование Политология Производство Психология Стандартизация Технологии |
|
|
Архитектура Аудит Военная наука Иностранные языки Медицина Металлургия Метрология Образование Политология Производство Психология Стандартизация Технологии |
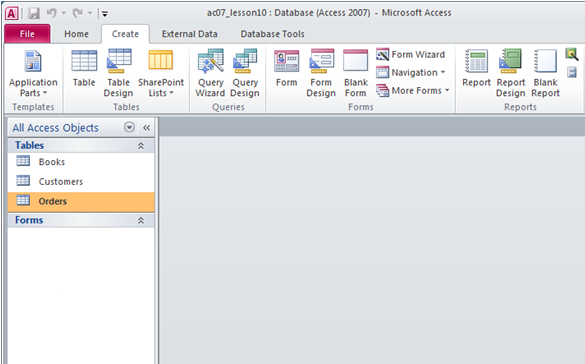
To use the Report button:
As with other objects, you can also save a report by right-clicking the reports tab and selecting Save. Saved reports appear in the Navigation pane.
Use the Report Wizard You can also use the Report Wizard to create a report. The Report Wizard provides you with more flexibility than you get by using the Report button. You can choose the tables and fields, group the data, sort the data, summarize the data, choose a layout and orientation, apply a style, and title your report. Follow the steps shown here to create a report by using the Report Wizard: To create a report by using the Report Wizard: Open the Report Wizard
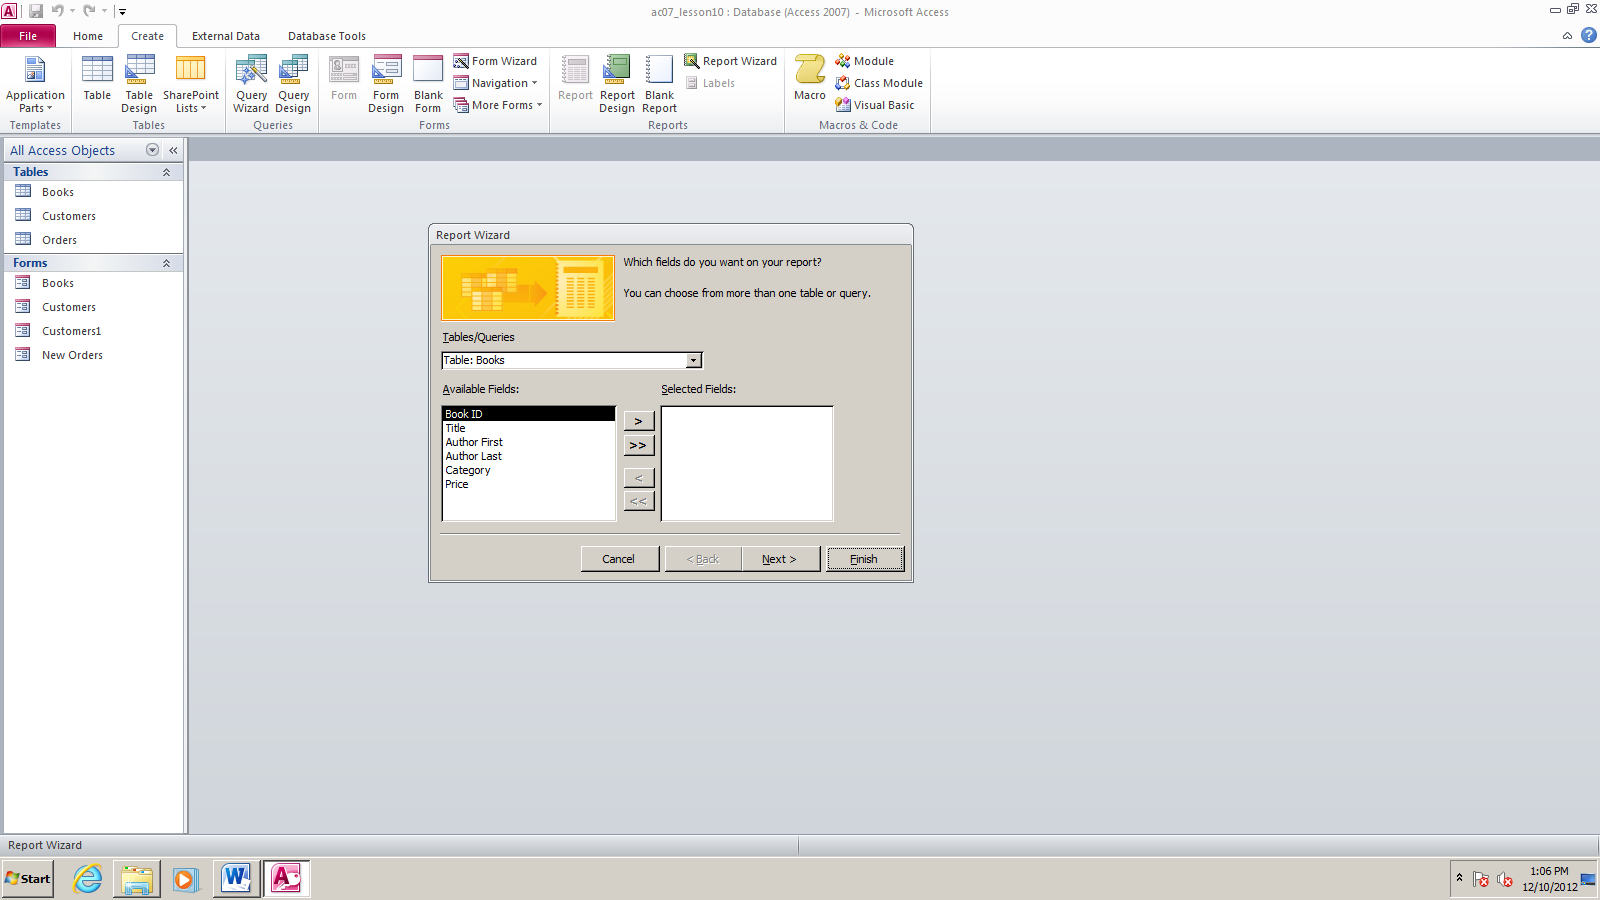
30. Click the down-arrow next to the Table/Queries field and then click the table from which you want to select fields.
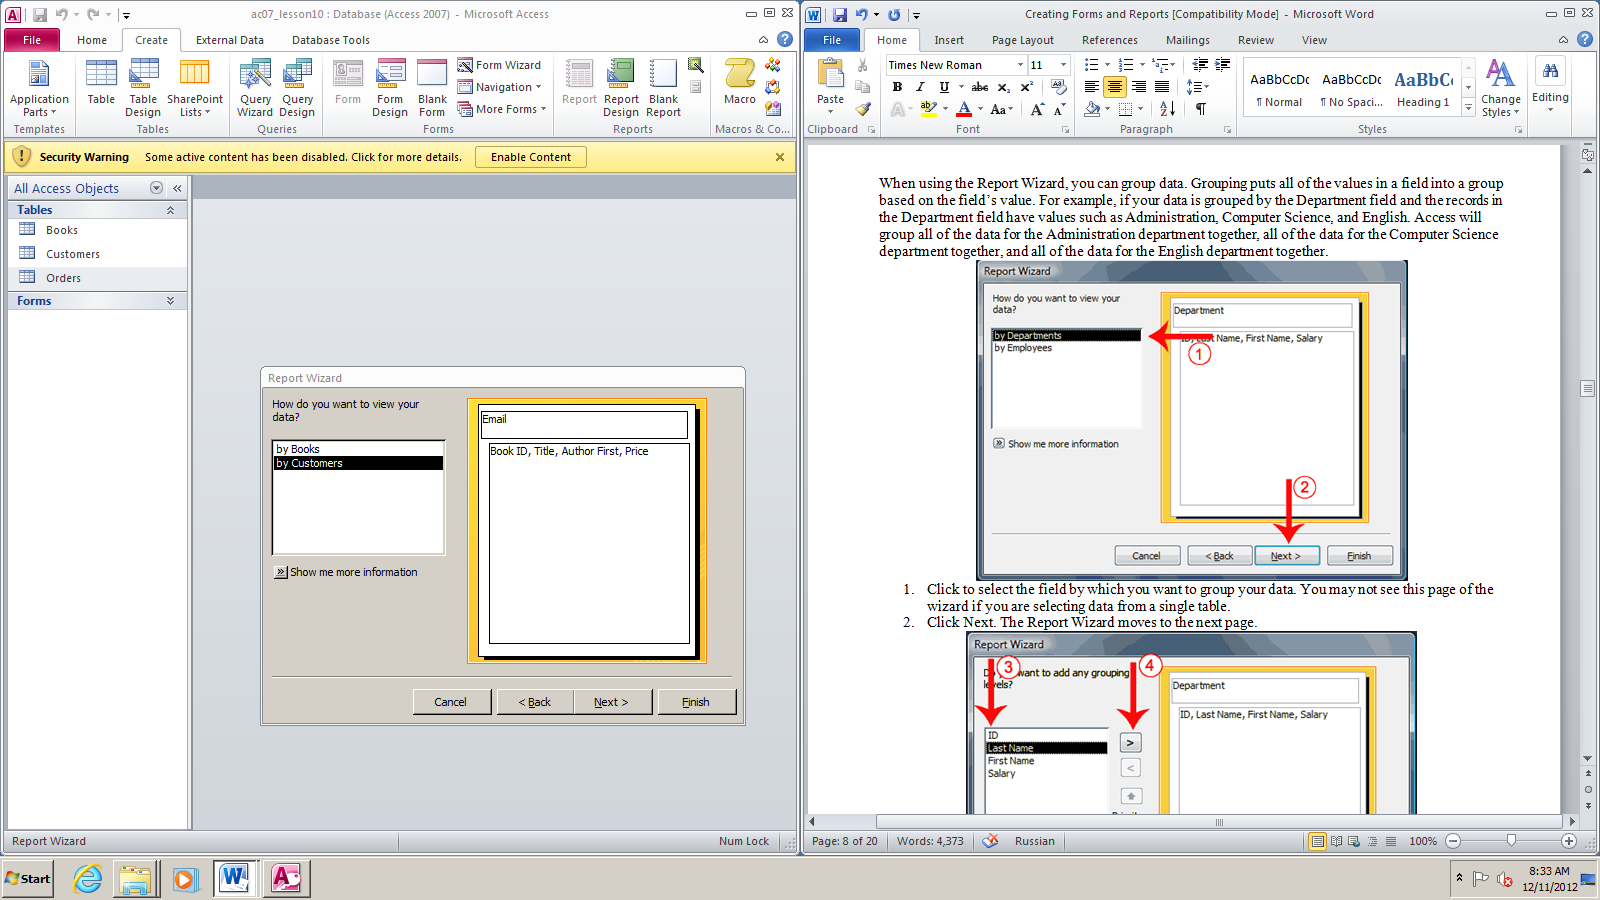
When using the Report Wizard, you can group data. Grouping puts all of the values in a field into a group based on the field’s value. For example, if your data is grouped by the Department field and the records in the Department field have values such as Administration, Computer Science, and English. Access will group all of the data for the Administration department together, all of the data for the Computer Science department together, and all of the data for the English department together.

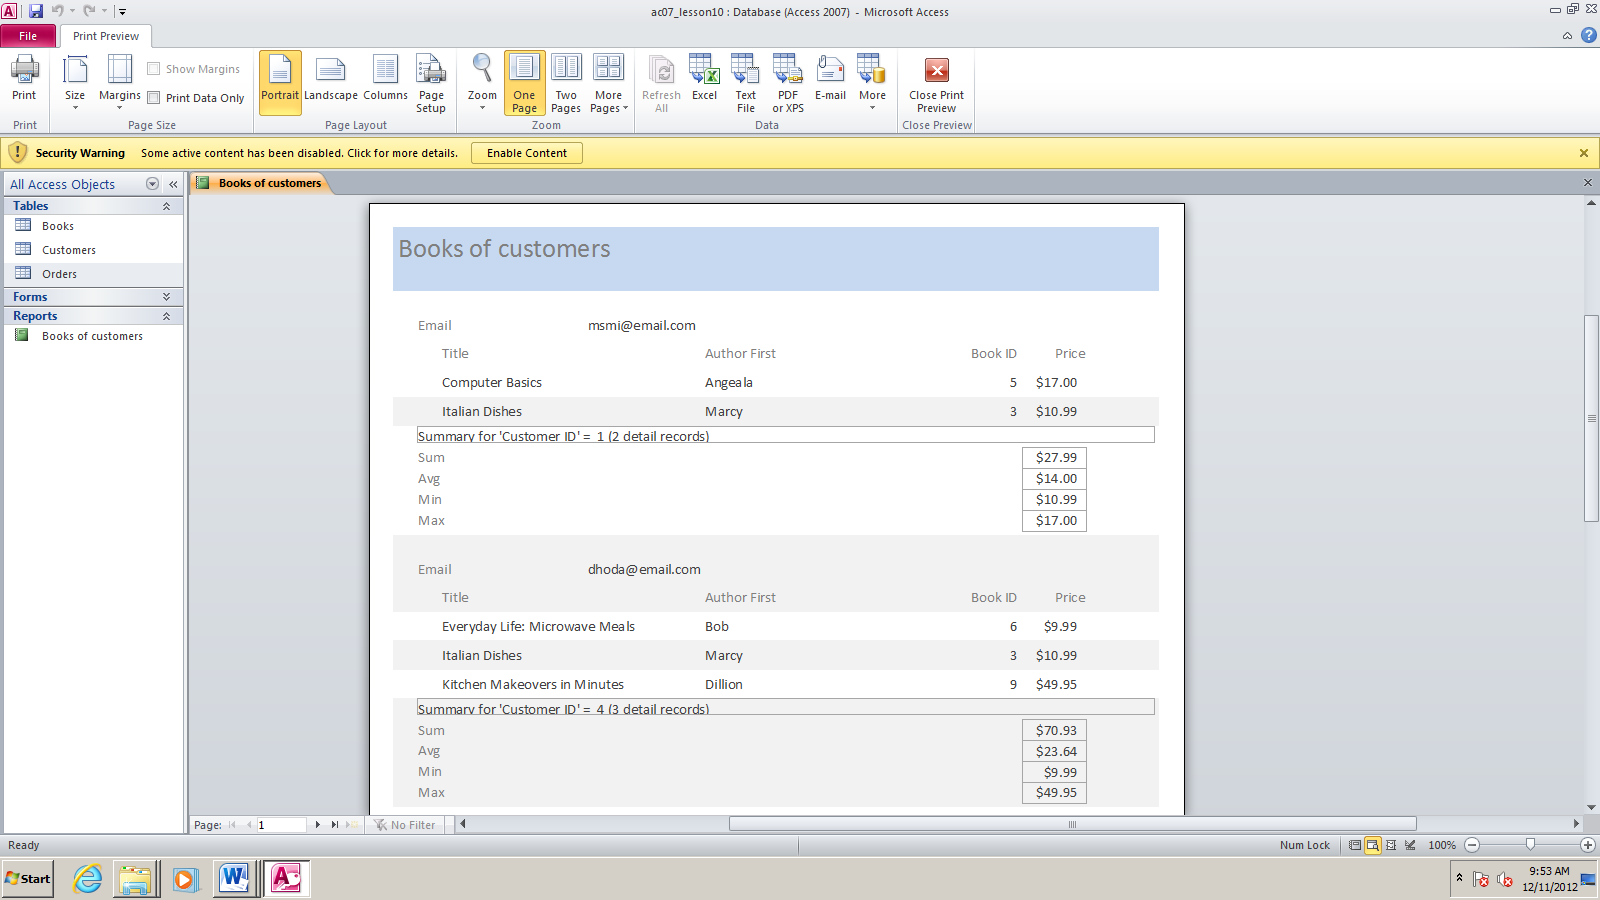
Sort and summarize By using the Report Wizard, you can create up to four levels of sort. Access sorts the first level, and then sorts the second level within that sort, and so on. If you have grouped your data, you can summarize it by displaying the sum, average, and minimum or maximum value for each numeric field. You can choose to have your report display just the summary data or each detail line and the summary data. There is also an option that allows you to display the percent the sum of each group is of the grand total. All of the fields in your report may not fit on a single page. You can have Access automatically adjust the size of the font so that every field fits.


Layout and orientation You can choose the layout and orientation of your report. The layout determines where each field appears on the page. Access provides three options to choose from: Stepped, Block, and Outline. When you choose an option, the left side of the window displays a graphic of the layout. Orientation determines whether Access creates the report in portrait or landscape. Most paper, such as paper sized 8 1/2 by 11, is longer on one edge than it is on the other. If you print in Portrait, the shortest edge of the paper becomes the top of the page. Portrait is the default option. If you print Landscape, the longest edge of the paper becomes the top of the page.
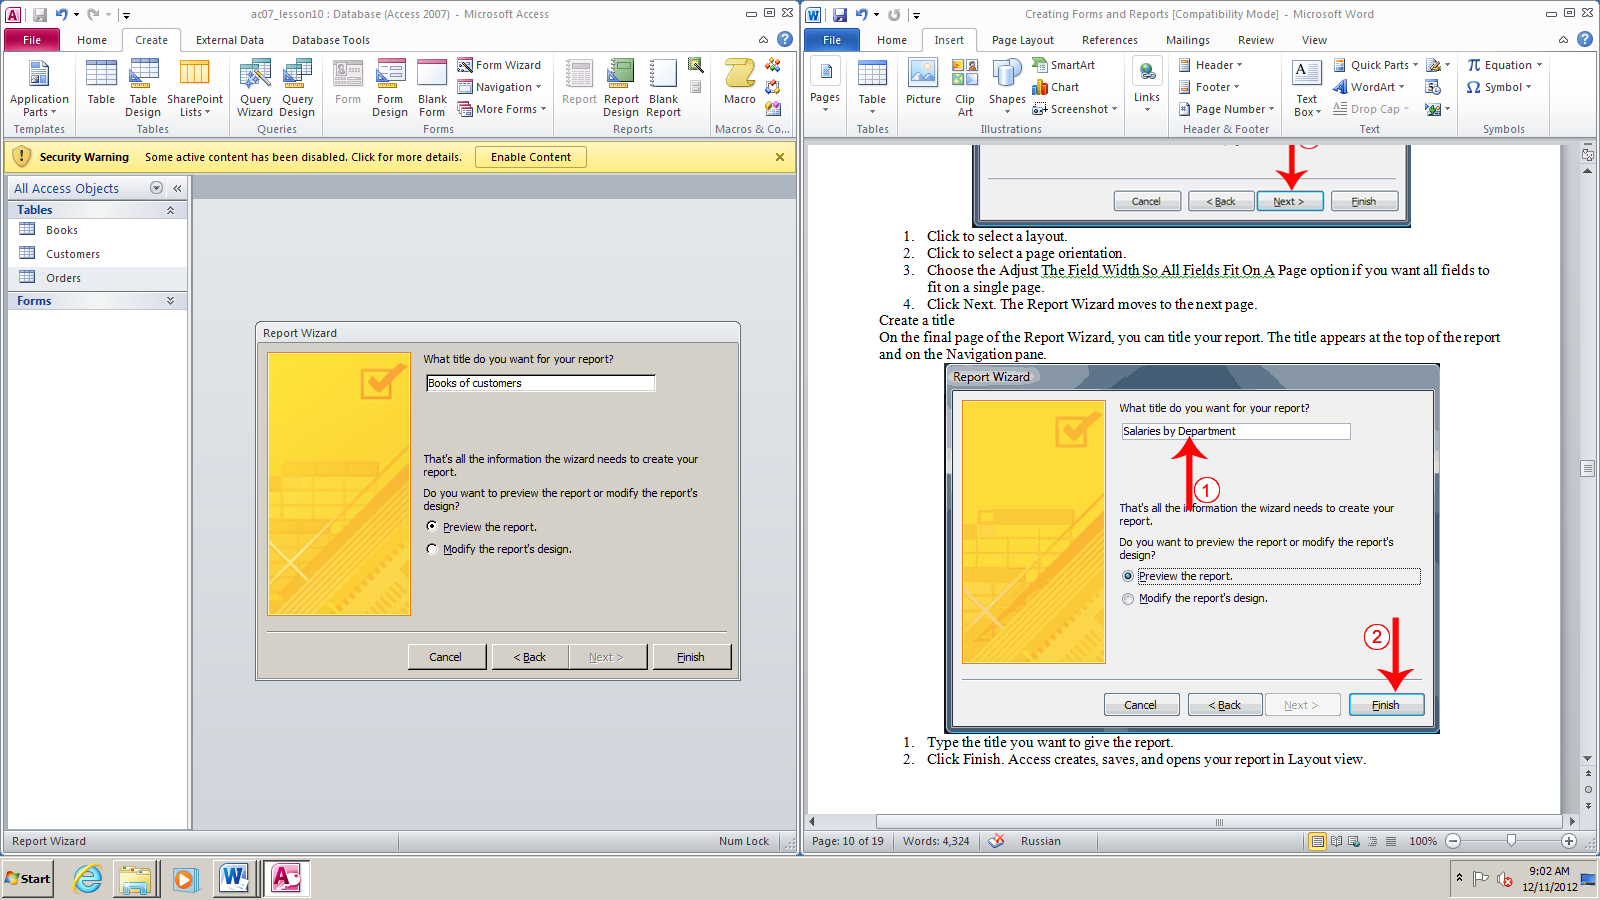
Create a title On the final page of the Report Wizard, you can title your report. The title appears at the top of the report and on the Navigation pane.
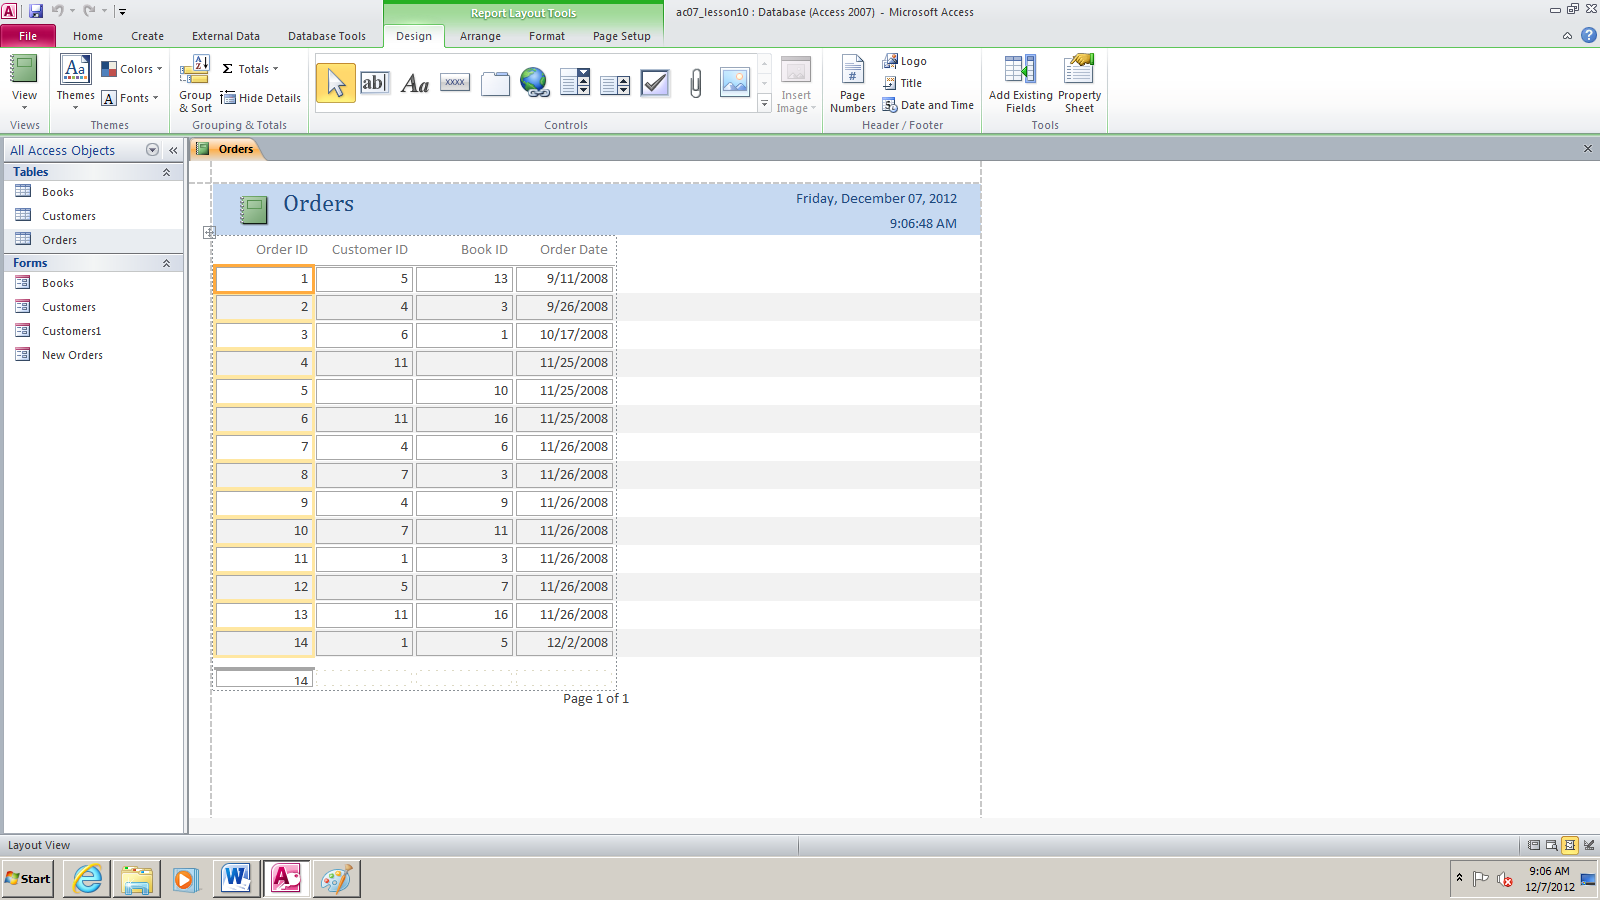
Modify a Report After you create a report, you can modify it. You can add groups or sorts, add fields, change labels, and perform many other tasks. You can view a report in Report view, Layout view, Design view, and Print Preview. You can modify a report in Layout view or Design view. In Layout view, you can see your data, and the report you see closely resembles how your report will look when you print it. You can make most, but not all, changes to your report in Layout view. Design view displays the structure of your report. In this view you cannot see the underlying data, but you can perform some tasks in Design view that you cannot perform in Layout view. This tutorial focuses on Layout view. To change to Layout view: |
|||||||||||||||||||||||||||||||||||||||||||||||||||
Последнее изменение этой страницы: 2019-03-31; Просмотров: 340; Нарушение авторского права страницы
 Tip: After you create a report, you can save it.